State School

Best of School
Haberdashers' Adams
- Secondary
- Newport TF10 7BD
1 schools in compare list
Ofsted report
Notify us of new Ofsted report
| The quality of education | Good |
| Behaviour and attitudes | Outstanding |
| Personal development | Good |
| Leadership and management | Good |
| Previous inspection grade | Outstanding |
| Sixth-form provision | Good |
Quick insights from ofsted Powered by AI
This insight was generated by AI, based on latest Ofsted report.
Academic Progress: Pupils achieve very well at both GCSE and A level.
Behaviour and Attitudes: Pupils behave exceptionally well and are polite and respectful.
Strengths and Challenges: Teachers are highly knowledgeable and passionate advocates for their subjects.
Opportunities for Involvement: Parents and carers are overwhelmingly positive about the school.
Communication: Parents value the support their children are given.
Parent Satisfaction: Parents recognise and value the support their children receive.
Handling Conflicts and Concerns: Bullying is dealt with swiftly by staff.
Actions for Quality Improvement: Leaders have begun addressing the RSE curriculum.
Managing Bullying and Safety: Bullying is extremely rare and handled swiftly.
Promoting Welfare and Safety: Safeguarding systems are appropriate, but some aspects need centralization.
Extracurricular Offerings: Wealth of extra-curricular clubs including musical theatre, choir, and sports.
Balancing Academics and Extracurriculars: Large numbers participate in sport, music, and dance events.
Career Counselling Services: Effective careers information with annual careers fair and interviews.
Preparation for Sixth Form: Sixth form students receive talks from professionals and develop skills for CV writing.
Managing and Supporting SEND: Pupils with SEND are well supported with ambitious leaders understanding individual needs.
Subjects Offered: Wide range of subjects offered at both GCSE and A level.
Historical Ofsted reports
Contact
About Us
Haberdashers' Adams is a top rated, Secondary, Co-Ed school located in Shropshire County, West Midlands.
It has 1114 students from age 11-18 yr.
At this school, 98% of pupils achieved grade 5 or more at GCSE.
97.80% of pupils completing their main study programme.
This school rated Good by recent Ofsted inspection.
Open Day Events
Open day
Type of SEN provision
Distance calculator
Simply click on 'Detect My Location' to find out the distance from your current location to the school.
Haberdashers' Adams
Nearby Schools in Your Area
From the Haberdashers' Adams
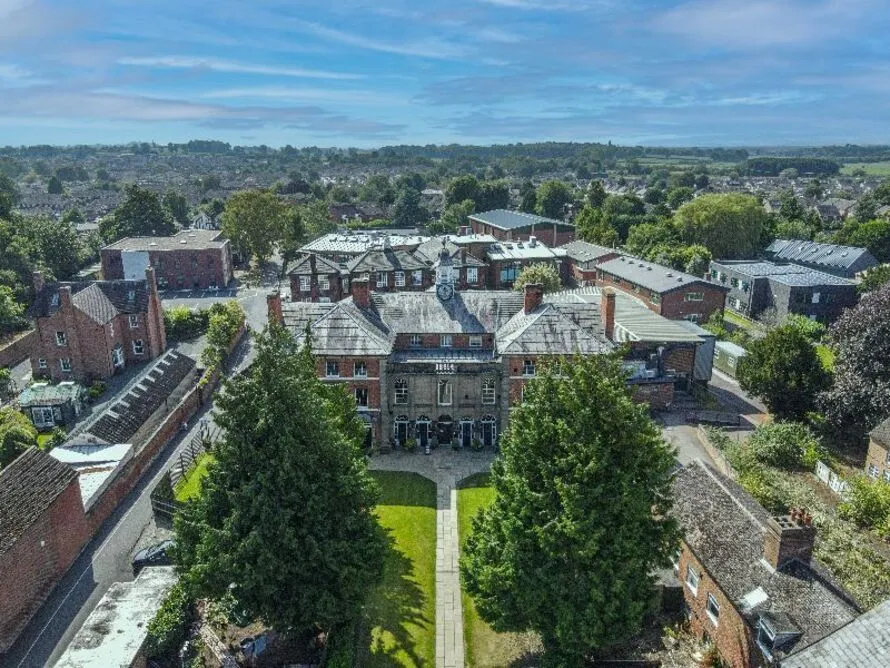
Haberdashers’ Adams has been a free grammar school since it was founded over 350 years ago and offers an exceptional education for boys aged 11-18 and girls aged 16-18. It intends to go fully co-ed from September 2024. Our reputation for high academic results is equalled by a strong house system and a huge variety of enrichment activities. Haberdashers’ Adams is one of just a few state grammar schools in the UK to have a boarding facility. Around one hundred of our pupils are boarders (boys only) and boarding contributes much to the ethos of the school.
Junior boarders (Years 7-10) start their boarding life at Longford Hall, a beautiful Grade II* listed Georgian mansion, set in one hundred acres of grounds, with magnificent views of the surrounding countryside. They are cared for by a boarding housemaster and his team of matrons and tutors who all work together to create a welcoming and homely environment.
Senior boarders (Years 11-13) continue their boarding life in Beaumaris Hall, our purpose-built home metres from the entrance to the main school. Senior boarding aims to help pupils gain additional independence and is an ideal stepping stone between home life and university. Across the two facilities, we offer the best of town and country living.
The only fees payable at Haberdashers’ Adams are those associated with boarding which means we are able to offer a full boarding school education for considerably less than any independent school. Our current boarding fees for 2023/24 are £4,619 per term for years 7-11 and £5,065 per term for Sixth Form. This includes full board, with the option to go home at weekends, three main meals a day (plus refreshments and supper), laundry, supervised prep and a variety of extracurricular and social activities.
Read more
Junior boarders (Years 7-10) start their boarding life at Longford Hall, a beautiful Grade II* listed Georgian mansion, set in one hundred acres of grounds, with magnificent views of the surrounding countryside. They are cared for by a boarding housemaster and his team of matrons and tutors who all work together to create a welcoming and homely environment.
Senior boarders (Years 11-13) continue their boarding life in Beaumaris Hall, our purpose-built home metres from the entrance to the main school. Senior boarding aims to help pupils gain additional independence and is an ideal stepping stone between home life and university. Across the two facilities, we offer the best of town and country living.
The only fees payable at Haberdashers’ Adams are those associated with boarding which means we are able to offer a full boarding school education for considerably less than any independent school. Our current boarding fees for 2023/24 are £4,619 per term for years 7-11 and £5,065 per term for Sixth Form. This includes full board, with the option to go home at weekends, three main meals a day (plus refreshments and supper), laundry, supervised prep and a variety of extracurricular and social activities.
Gallery


Facilities

Compare with similar schools
| Phase of Education | Secondary | Secondary | Secondary |
|---|---|---|---|
| Type | Academies | Academies | Academies |
| Snobe grade |
B-
|
A-
|
-
|
| Ofset report | Good | Outstanding | - |
| Age range | 11-18 | 11-18 | 11-16 |


| Gender | Co-Ed | Girls | Co-Ed |
|---|---|---|---|
| Student teacher ratio | - | 18 | - |
| Proficient Math | - | - | - |
| Proficient Read | - | - | - |
| Grade 5 or above GCSE | 98% | 99% | - |
| Grade 5 or above A Level | 35.00% | 39.20% | - |
| Day Fees | - | - | - |
Secondary Exam Result
Discover school's performance with the Attainment 8 and Progress 8 scores. Attainment 8 reflects pupil achievement in 8 qualifications, while Progress 8 measures their progress from key stage 2 to 4, compared to peers across England.
| School scores | School | Description |
|---|---|---|
| Progress 8 score | 0.40 | This score shows how much progress pupils at this school made across 8 qualifications between the end of key stage 2 and the end of key stage 4. |
| Attainment 8 score | 73.7 | Schools get a score based on how well pupils have performed in up to 8 qualifications. |
Explore the percentage of pupils who attained grade 5 or higher & grade 4 or higher in their English and math GCSEs. This metric reflects their proficiency in these fundamental subjects.
| GCSE Results | School | LA | England |
|---|---|---|---|
| Grade 5 or above in English & Maths GCSEs | 98% | 28.11% | 30.02% |
| Grade 4 or above in English & Maths GCSEs | 100% | 37.44% | 43.07% |
The English Baccalaureate (EBacc) ensures your child's well-rounded education. It includes essential subjects like English, math, sciences, languages, and humanities.
| EBacc Results | School | LA | England |
|---|---|---|---|
| Entering EBacc | 69% | 24.56% | 25.06% |
| Achieving the EBacc at grade 5 or above | 55% | 14.11% | 10.92% |
| Achieving the EBacc at grade 4 or above | 66% | 18.44% | 15.51% |
| EBacc average points score | 6.88 | 2.69 | 2.83 |
Find out where our Key Stage 4 graduates are going next. Explore their different paths after finishing school – whether it's sixth form, starting work, or other adventures as they move forward.
| Pupil destinations | School | LA | England |
|---|---|---|---|
| Pupils staying in education or employment | 100% | 92.46% | 90.53% |
| Total number of pupils included in destination measures | 119 | 126 | 144 |
| Pupils staying in education | 100% | 86.08% | 84.16% |
| Further education college or other further education provider | 5% | 36.92% | 32.73% |
| School sixth forms | 85% | 32.31% | 29.8% |
| Sixth form colleges | 7% | 11.38% | 10.22% |
| Other education destinations | 3% | 5.62% | 11.43% |
| Pupils in apprenticeships | 0% | 2.92% | 2.8% |
| Pupils staying in employment | 0% | 3.31% | 3.59% |
Discover school's performance with the Attainment 8 and Progress 8 scores. Attainment 8 reflects pupil achievement in 8 qualifications, while Progress 8 measures their progress from key stage 2 to 4, compared to peers across England.
| School scores | School | Description |
|---|---|---|
| Progress 8 score | 0.39 | This score shows how much progress pupils at this school made across 8 qualifications between the end of key stage 2 and the end of key stage 4. |
| Attainment 8 score | 76.3 | Schools get a score based on how well pupils have performed in up to 8 qualifications. |
Explore the percentage of pupils who attained grade 5 or higher & grade 4 or higher in their English and math GCSEs. This metric reflects their proficiency in these fundamental subjects.
| GCSE Results | School | LA | England |
|---|---|---|---|
| Grade 5 or above in English & Maths GCSEs | 98% | 28.53% | 32.85% |
| Grade 4 or above in English & Maths GCSEs | 100% | 38.58% | 45.33% |
The English Baccalaureate (EBacc) ensures your child's well-rounded education. It includes essential subjects like English, math, sciences, languages, and humanities.
| EBacc Results | School | LA | England |
|---|---|---|---|
| Entering EBacc | 63% | 23.42% | 24.94% |
| Achieving the EBacc at grade 5 or above | 52% | 14.68% | 13.02% |
| Achieving the EBacc at grade 4 or above | 59% | 18.68% | 17.19% |
| EBacc average points score | 7.08 | 2.73 | 2.97 |
Find out where our Key Stage 4 graduates are going next. Explore their different paths after finishing school – whether it's sixth form, starting work, or other adventures as they move forward.
| Pupil destinations | School | LA | England |
|---|---|---|---|
| Pupils staying in education or employment | 100% | 95.77% | 90.4% |
| Total number of pupils included in destination measures | 122 | 121 | 141 |
| Pupils staying in education | 99% | 92.62% | 86.29% |
| Further education college or other further education provider | 2% | 42.54% | 34.03% |
| School sixth forms | 90% | 34.92% | 30.82% |
| Sixth form colleges | 4% | 8.77% | 10.38% |
| Other education destinations | 3% | 6.69% | 11.08% |
| Pupils in apprenticeships | 1% | 2.23% | 1.99% |
| Pupils staying in employment | 0% | 0.92% | 2.13% |
Exam Result Not Published
Due to the pandemic, 2020 and 2021 Secondary school exam
results were not published at school level.
Exam Result Not Published
Due to the pandemic, 2020 and 2021 Secondary school exam
results were not published at school level.
Discover school's performance with the Attainment 8 and Progress 8 scores. Attainment 8 reflects pupil achievement in 8 qualifications, while Progress 8 measures their progress from key stage 2 to 4, compared to peers across England.
| School scores | School | Description |
|---|---|---|
| Progress 8 score | 0.24 | This score shows how much progress pupils at this school made across 8 qualifications between the end of key stage 2 and the end of key stage 4. |
| Attainment 8 score | 71.8 | Schools get a score based on how well pupils have performed in up to 8 qualifications. |
Explore the percentage of pupils who attained grade 5 or higher & grade 4 or higher in their English and math GCSEs. This metric reflects their proficiency in these fundamental subjects.
| GCSE Results | School | LA | England |
|---|---|---|---|
| Grade 5 or above in English & Maths GCSEs | 95% | 28.25% | 29.3% |
| Grade 4 or above in English & Maths GCSEs | 98% | 38.38% | 43.41% |
The English Baccalaureate (EBacc) ensures your child's well-rounded education. It includes essential subjects like English, math, sciences, languages, and humanities.
| EBacc Results | School | LA | England |
|---|---|---|---|
| Entering EBacc | 76% | 24.69% | 25.81% |
| Achieving the EBacc at grade 5 or above | 50% | 14.31% | 11.47% |
| Achieving the EBacc at grade 4 or above | 69% | 19.06% | 16.49% |
| EBacc average points score | 6.73 | 2.82 | 2.88 |
Find out where our Key Stage 4 graduates are going next. Explore their different paths after finishing school – whether it's sixth form, starting work, or other adventures as they move forward.
| Pupil destinations | School | LA | England |
|---|---|---|---|
| Pupils staying in education or employment | 99% | 94.64% | 90.2% |
| Total number of pupils included in destination measures | 111 | 102 | 135 |
| Pupils staying in education | 98% | 90.36% | 84.08% |
| Further education college or other further education provider | 2% | 36.45% | 33.25% |
| School sixth forms | 94% | 36.09% | 31.27% |
| Sixth form colleges | 1% | 15.64% | 8.45% |
| Other education destinations | 2% | 2.18% | 11.14% |
| Pupils in apprenticeships | 1% | 2.91% | 3.4% |
| Pupils staying in employment | 0% | 1.36% | 2.75% |
Discover school's performance with the Attainment 8 and Progress 8 scores. Attainment 8 reflects pupil achievement in 8 qualifications, while Progress 8 measures their progress from key stage 2 to 4, compared to peers across England.
| School scores | School | Description |
|---|---|---|
| Progress 8 score | 0.48 | This score shows how much progress pupils at this school made across 8 qualifications between the end of key stage 2 and the end of key stage 4. |
| Attainment 8 score | 72.9 | Schools get a score based on how well pupils have performed in up to 8 qualifications. |
Explore the percentage of pupils who attained grade 5 or higher & grade 4 or higher in their English and math GCSEs. This metric reflects their proficiency in these fundamental subjects.
| GCSE Results | School | LA | England |
|---|---|---|---|
| Grade 5 or above in English & Maths GCSEs | 95% | 32.08% | 29.22% |
| Grade 4 or above in English & Maths GCSEs | 99% | 42.42% | 42.63% |
The English Baccalaureate (EBacc) ensures your child's well-rounded education. It includes essential subjects like English, math, sciences, languages, and humanities.
| EBacc Results | School | LA | England |
|---|---|---|---|
| Entering EBacc | 86% | 28.58% | 24.74% |
| Achieving the EBacc at grade 5 or above | 67% | 18.5% | 11.33% |
| Achieving the EBacc at grade 4 or above | 78% | 23.92% | 16.02% |
| EBacc average points score | 7.04 | 3.04 | 2.84 |
Find out where our Key Stage 4 graduates are going next. Explore their different paths after finishing school – whether it's sixth form, starting work, or other adventures as they move forward.
| Pupil destinations | School | LA | England |
|---|---|---|---|
| Pupils staying in education or employment | 97% | 83.22% | 84.87% |
| Total number of pupils included in destination measures | 116 | 105 | 140 |
| Pupils staying in education | 97% | 69.33% | 73.88% |
| Further education college or other further education provider | - | 20.56% | 28.31% |
| School sixth forms | 90% | 40.33% | 31.6% |
| Sixth form colleges | 6% | 8.11% | 9.08% |
| Other education destinations | - | 1% | 5.87% |
| Pupils in apprenticeships | - | 1% | 2.96% |
| Pupils staying in employment | - | 1.22% | 2.05% |
Discover school's performance with the Attainment 8 and Progress 8 scores. Attainment 8 reflects pupil achievement in 8 qualifications, while Progress 8 measures their progress from key stage 2 to 4, compared to peers across England.
| School scores | School | Description |
|---|---|---|
| Progress 8 score | 0.2 | This score shows how much progress pupils at this school made across 8 qualifications between the end of key stage 2 and the end of key stage 4. |
| Attainment 8 score | 72.1 | Schools get a score based on how well pupils have performed in up to 8 qualifications. |
Explore the percentage of pupils who attained grade 5 or higher & grade 4 or higher in their English and math GCSEs. This metric reflects their proficiency in these fundamental subjects.
| GCSE Results | School | LA | England |
|---|---|---|---|
| Grade 5 or above in English & Maths GCSEs | 96% | 39.4% | 29.55% |
| Grade 4 or above in English & Maths GCSEs | 100% | 51.6% | 43.07% |
The English Baccalaureate (EBacc) ensures your child's well-rounded education. It includes essential subjects like English, math, sciences, languages, and humanities.
| EBacc Results | School | LA | England |
|---|---|---|---|
| Entering EBacc | 83% | 36.5% | 25.25% |
| Achieving the EBacc at grade 5 or above | 74% | 25.9% | 14.71% |
| Achieving the EBacc at grade 4 or above | 74% | 26.9% | 16.26% |
| EBacc average points score | - | - | - |
Find out where our Key Stage 4 graduates are going next. Explore their different paths after finishing school – whether it's sixth form, starting work, or other adventures as they move forward.
| Pupil destinations | School | LA | England |
|---|---|---|---|
| Pupils staying in education or employment | 99% | 81.5% | 85.29% |
| Total number of pupils included in destination measures | 109 | 107 | 145 |
| Pupils staying in education | - | 54.63% | 58.19% |
| Further education college or other further education provider | - | 25.63% | 30.58% |
| School sixth forms | 94% | 37.5% | 32.22% |
| Sixth form colleges | - | 9.38% | 8.95% |
| Other education destinations | - | 0.25% | 5.7% |
| Pupils in apprenticeships | - | 3.88% | 4.78% |
| Pupils staying in employment | - | 3% | 2.45% |
A level exam result
Explore their results and progress scores, showing how they've grown and achieved during this important stage of their education.
| A level Result | School | LA | England |
|---|---|---|---|
| Average points | 39.58 | 32.75 | 30.01 |
| Average grade | B | - | - |
| Average points (Best 3) | 39.89 | 33.22 | 29.57 |
| Average Grade (Best 3) | B | - | - |
| AAB or higher | 35.00% | 16.04% | 13.67% |
Discover where pupils headed after A-levels. Explore who either stayed in education or went into employment.
| Students destinations | School | LA | England |
|---|---|---|---|
| Number of students | 175 | 222 | 201 |
| Students staying in education | 63% | 61.83% | 58.58% |
| Students entering apprenticeships | 6% | 8% | 6.08% |
| Students entering employment | 22% | 19.5% | 21.16% |
| Students not in education or employment for at least two terms after study | 6% | 7.5% | 9.05% |
Explore their results and progress scores, showing how they've grown and achieved during this important stage of their education.
| A level Result | School | LA | England |
|---|---|---|---|
| Average points | 43.47 | 36.77 | 33.41 |
| Average grade | B+ | - | - |
| Average points (Best 3) | 42.84 | 37.65 | 32.47 |
| Average Grade (Best 3) | B+ | - | - |
| AAB or higher | 40.4% | 19.95% | 17.7% |
Discover where pupils headed after A-levels. Explore who either stayed in education or went into employment.
| Students destinations | School | LA | England |
|---|---|---|---|
| Number of students | 153 | 231 | 248 |
| Students staying in education | 82% | 65.43% | 60.67% |
| Students entering apprenticeships | 3% | 5.43% | 5% |
| Students entering employment | 7% | 20.43% | 17.73% |
| Students not in education or employment for at least two terms after study | 5% | 7.29% | 10.69% |
Exam Result Not Published
Due to the pandemic, 2020 and 2021 A level school exam
results were not published at school level.
Exam Result Not Published
Due to the pandemic, 2020 and 2021 A level school exam
results were not published at school level.
Explore their results and progress scores, showing how they've grown and achieved during this important stage of their education.
| A level Result | School | LA | England |
|---|---|---|---|
| Average points | 41.53 4 | 28.92 | 29.39 |
| Average grade | B | - | - |
| Average points (Best 3) | 42.63 3 | 30.89 | 28.64 |
| Average Grade (Best 3) | B+ | - | - |
| AAB or higher | 37.3% | 13.88% | 13.07% |
Discover where pupils headed after A-levels. Explore who either stayed in education or went into employment.
| Students destinations | School | LA | England |
|---|---|---|---|
| Number of students | 152 | 183 | 232 |
| Students staying in education | 68% | 63.14% | 57.31% |
| Students entering apprenticeships | 3% | 7.29% | 7.77% |
| Students entering employment | 17% | 21.29% | 20.99% |
| Students not in education or employment for at least two terms after study | 5% | 6% | 8.8% |
Explore their results and progress scores, showing how they've grown and achieved during this important stage of their education.
| A level Result | School | LA | England |
|---|---|---|---|
| Average points | 37.23 1 | 33.74 | 29.03 |
| Average grade | B- | - | - |
| Average points (Best 3) | 39.40 2 | 34.84 | 28.82 |
| Average Grade (Best 3) | B | - | - |
| AAB or higher | 32.0% | 16.73% | 13.37% |
Discover where pupils headed after A-levels. Explore who either stayed in education or went into employment.
| Students destinations | School | LA | England |
|---|---|---|---|
| Number of students | 4 | 0 | 3 |
| Students staying in education | - | 10.67% | 31.5% |
| Students entering apprenticeships | - | 4.83% | 5.54% |
| Students entering employment | - | 7.83% | 15.81% |
| Students not in education or employment for at least two terms after study | 5% | 3.5% | 4.22% |
Explore their results and progress scores, showing how they've grown and achieved during this important stage of their education.
| A level Result | School | LA | England |
|---|---|---|---|
| Average points | 36.57 | 28.04 | 26.73 |
| Average grade | B- | - | - |
| Average points (Best 3) | 37.7 | 30.54 | 27.73 |
| Average Grade (Best 3) | B- | - | - |
| AAB or higher | 29.5% | 11.66% | 12.64% |
Discover where pupils headed after A-levels. Explore who either stayed in education or went into employment.
| Students destinations | School | LA | England |
|---|---|---|---|
| Number of students | 4 | 0 | 3 |
| Students staying in education | 14 | 40% | 36.26% |
| Students entering apprenticeships | 3% | 8.67% | 6.37% |
| Students entering employment | 9% | 21% | 20.03% |
| Students not in education or employment for at least two terms after study | 5% | 2.83% | 4.23% |
Best Schools 2026
Haberdashers' Adams Rankings
Snobe ranks nearly 20,000+ schools according to their exam results, teaching quality, resources & many more indicators. (How Do We Calculate Rankings?)
How Do We Calculate Rankings?
Our school rankings are meticulously determined through a rigorous process:
This meticulous process ensures our rankings provide accurate and meaningful insights for your school choices.
Admission and Fees
Admission
Fees
| Program | Age | Fee |
|---|---|---|
| State Boarding | 11-18 yr | £5,278 (Term) |
Holidays & terms
Holidays 2024/25
| Holidays | Date |
|---|---|
| Autumn Half Term Holidays | 23rd Oct 2026 - 31st Oct 2026 |
| Winter Holidays | 18th Dec 2026 - 3rd Jan 2027 |
| Spring Half Term Holidays | 15th Feb 2027 - 19th Feb 2027 |
| Spring Holidays | 28th Mar 2027 - 11th Apr 2027 |
| Summer Half Term Holidays | 31st May 2027 - 4th Jun 2027 |
| Summer Holidays | 22nd Jul 2027 - 3rd Sep 2027 |
Terms Dates 2024/25
| Terms | Dates |
|---|---|
| Autumn Term | 3rd Sep 2026 - 22nd Oct 2026 |
| Autumn Term-2 | 2nd Nov 2026 - 17th Dec 2026 |
| Spring Term | 4th Jan 2027 - 12th Feb 2027 |
| Spring Term-2 | 22nd Feb 2027 - 25th Mar 2027 |
| Summer Term | 12th Apr 2027 - 28th May 2027 |
| Summer Term-2 | 8th Jun 2027 - 21st Jul 2027 |
Students Teachers